This page provides information about the summary feedback educators and students who participate in this before-after survey study will receive.
We aim to send participating module/unit co-ordinators a summary of their module students ‘before’ survey responses 3 weeks after the module/unit start date. Module/unit co-ordinators will then receive a before-after summary following students’ ‘after’ responses at the end of the module/unit.
Participating degree co-ordinators will receive a summary of their degree students ‘before’ survey responses in December (UK) and June (Australia). Degree co-ordinators will also receive a before-after summary following the ‘after’ responses at the end of the academic year. The summary feedback documents that educators receive will not include any individuals’ responses. The responses will be shown as aggregate summaries.
Students that complete both the ‘before’ and ‘after’ survey will receive their own bespoke summary. Their summary will include a comparison of their ‘before’ and ‘after’ responses, as well as graphs that allow them to see how their views compare to other students in the module/degree. You can click on the following links to see examples of the summary feedback files.
Example summary feedback files:
Example summary information
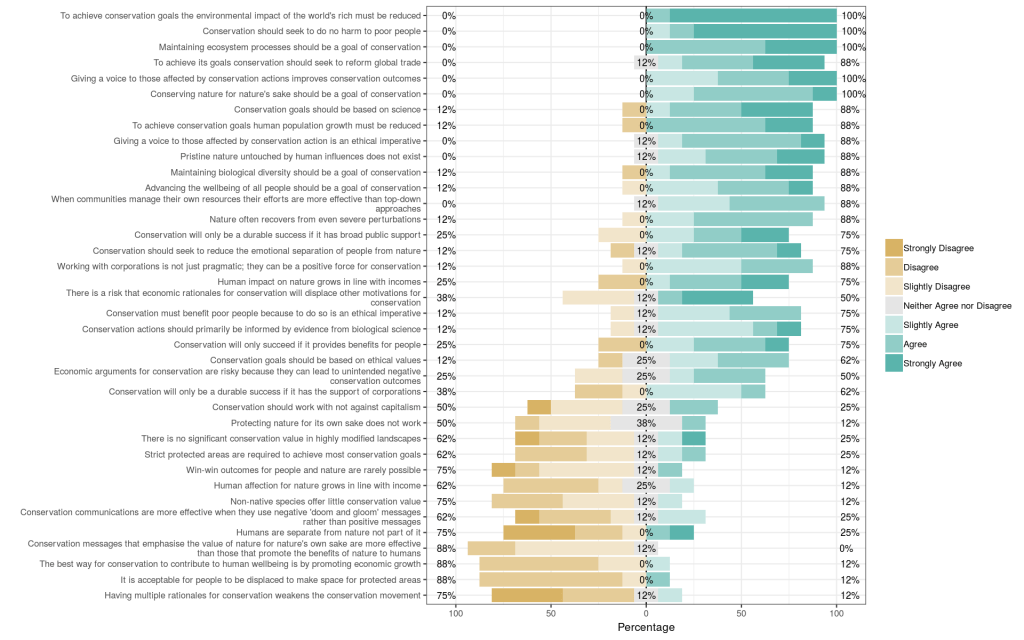
1. A summary of your students’ responses to the 38 conservation statements developed by the Future of Conservation project.
This graph will show you which statements your students’ have consensus on, and which statements have a wide range of Likert scale responses. In the before-after summary file, you will be able to see whether there is a change in the mean response to each statement.
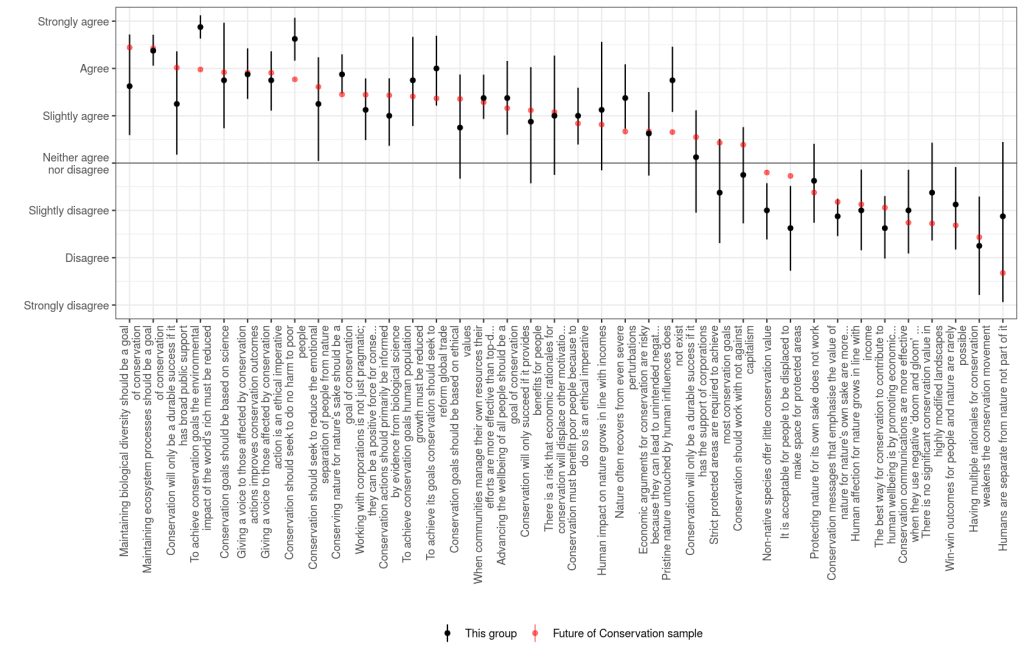
2. Extent of agreement summary
This graph will show you your students’ mean responses to each statement. The red dots are the Future of Conservation sample responses. This allows you to compare your students’ responses to the statements against the larger sample of conservationists in the Future of Conservation study.
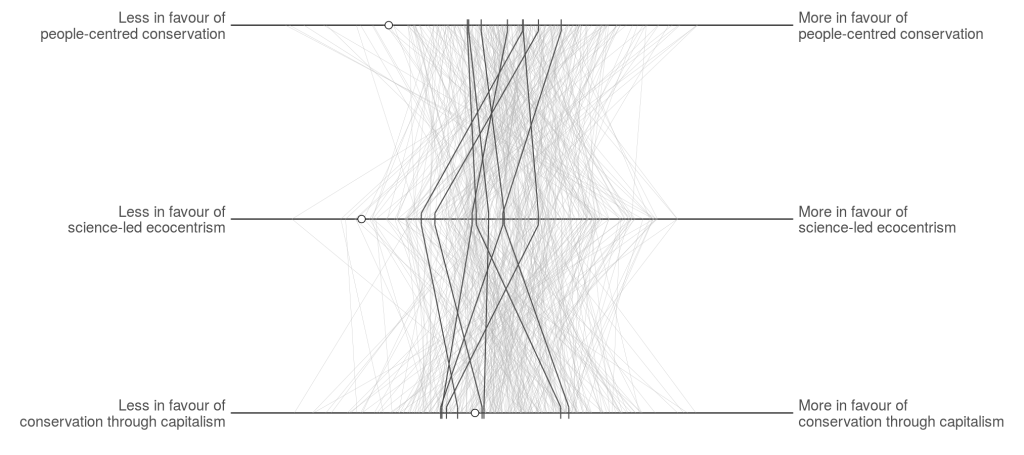
3. Three dimensions summary
Within this graph, you will be able to see where your students’ responses lie on the three dimensions identified in the Future of Conservation project. The light grey lines represent the Future of Conservation sample and the black lines represent student responses.
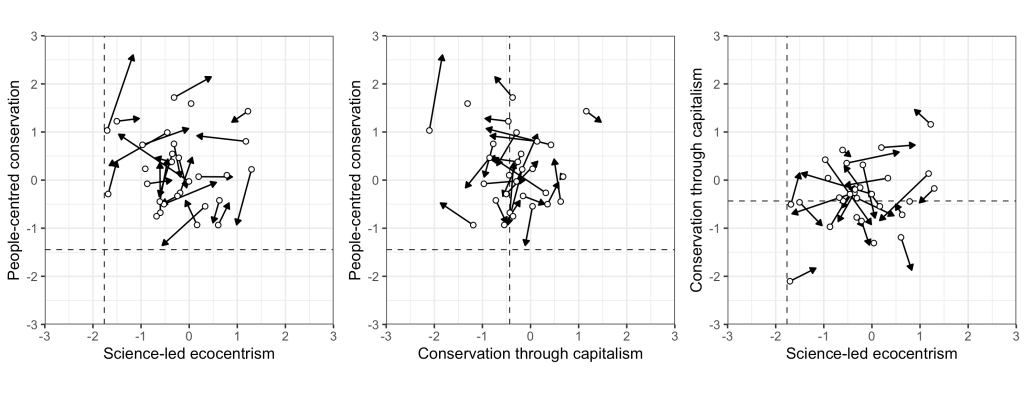
4. Before-after dimension scatter plots
The below three scatter plots will be included in the before-after class feedback files. The plots will allow you to see whether your students’ views have shifted in any particular direction in relation to the three dimensions identified in the Future of Conservation study.
Questions or comments?
If you have any questions about this survey or the wider research project, please contact Helena Slater on helena.slater@ed.ac.uk or the supervisory team:
Aidan Keane (University of Edinburgh)
Janet Fisher (University of Edinburgh)
George Holmes (University of Leeds)
Chris Sandbrook (University of Cambridge)
